Image 1: SPS in numbers
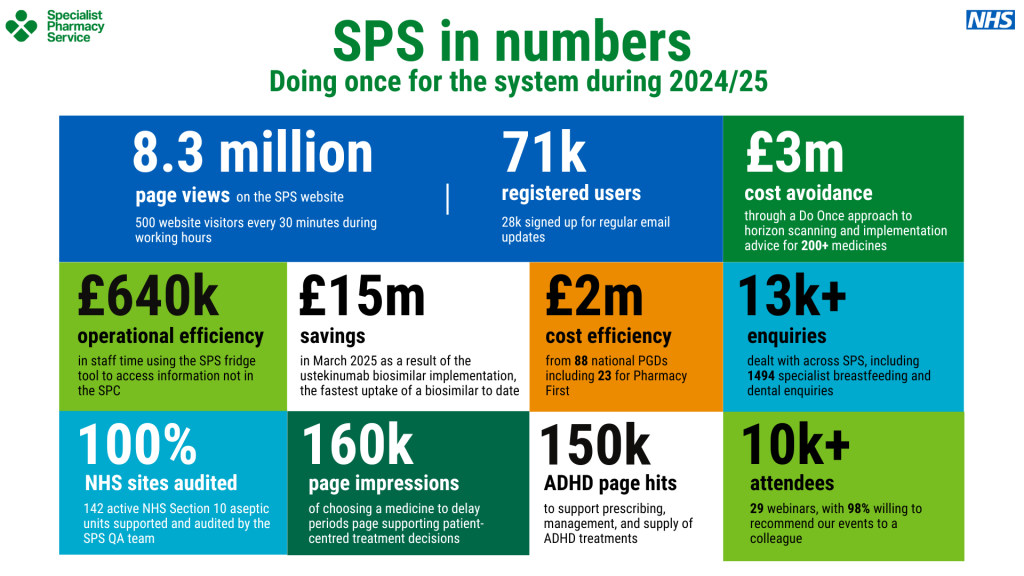
A slide titled “SPS in numbers – Doing once for the system during 2024/25” from the NHS Specialist Pharmacy Service (SPS). The slide displays a grid of coloured statistic boxes summarising SPS impact.
- A large blue box states: “8.3 million page views on the SPS website”, noting that 500 website visitors arrive every 30 minutes during working hours.
- Next to it, another blue box shows: “71k registered users”, including 28,000 signed up for regular email updates.
- A green box reads: “£3m cost avoidance” achieved through a “Do Once” approach to horizon scanning and implementation advice for more than 200 medicines.
Below these:
- A dark green box states: “£640k operational efficiency”, with savings in staff time using the SPS fridge tool to access information not in the SPC.
- A yellow box states: “£15m savings” in March 2025 due to coordinated ustekinumab biosimilar implementation.
- An orange box reads: “£2m cost efficiency” from 88 national PGDs, including 23 for Pharmacy First.
- A teal box states: “13k+ enquiries” dealt with across SPS, including 1,494 specialist breastfeeding and dental enquiries.
Along the bottom row:
- A blue box reads: “100% NHS sites audited”, describing 142 active NHS Section 10 aseptic units supported and audited by the SPS QA team.
- A green box shows: “160k page impressions” from the medicine switching guidance supporting patient centred treatment decisions.
- A teal box states: “150k ADHD page hits” supporting prescribing, management, and supply of ADHD treatments.
- A green box shows: “10k+ attendees” across 29 webinars, with 98% willing to recommend events to a colleague.
NHS and SPS logos appear at the top.
Image 2: The SPS website
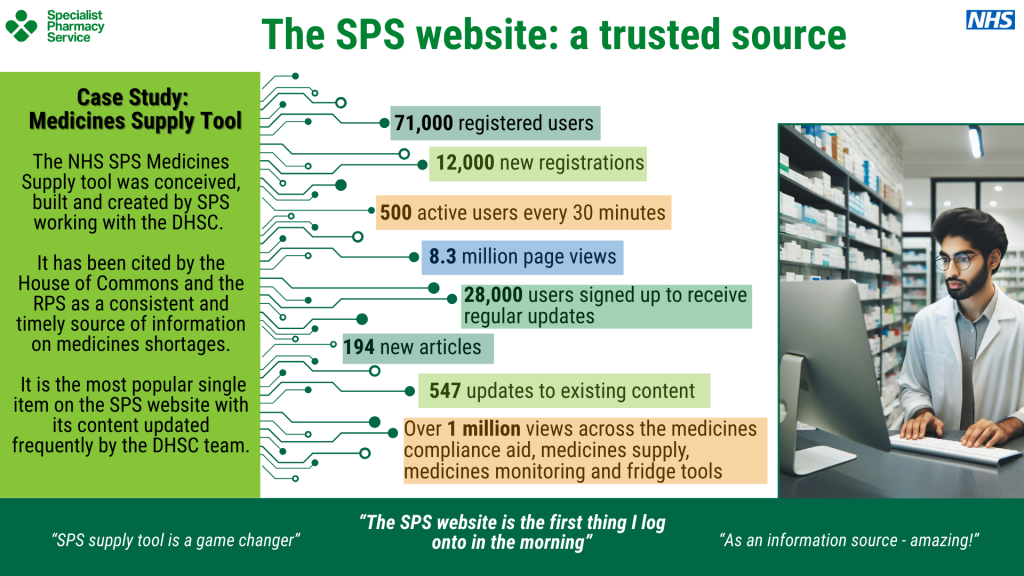
A slide titled “The SPS website: a trusted source” from the NHS Specialist Pharmacy Service (SPS). The slide summarises key statistics and describes the SPS Medicines Supply Tool.
On the left, a green box labelled “Case Study: Medicines Supply Tool” explains:
- The NHS SPS Medicines Supply Tool was designed, built, and created by SPS in partnership with the Department of Health and Social Care (DHSC).
- It has been cited by the House of Commons and the Royal Pharmaceutical Society as a consistent and timely source of information on medicine shortages.
- It is the most popular page on the SPS website, with content updated frequently by the DHSC team.
In the centre and right, a series of coloured statistic boxes are connected by circuit style lines:
- 71,000 registered users
- 12,000 new registrations
- 500 active users every 30 minutes
- 8.3 million page views
- 28,000 users signed up for regular updates
- 194 new articles
- 547 updates to existing content
- Over 1 million views across medicines compliance aid, medicine supply, medicines monitoring, and fridge tools
On the far right is an image of a pharmacy environment showing shelves stocked with medicines.
At the bottom, three quotes appear:
- “SPS supply tool is a game changer”
- “The SPS website is the first thing I log onto in the morning”
- “As an information source – amazing!”
NHS and SPS logos appear at the top.
Image 3: Shortages
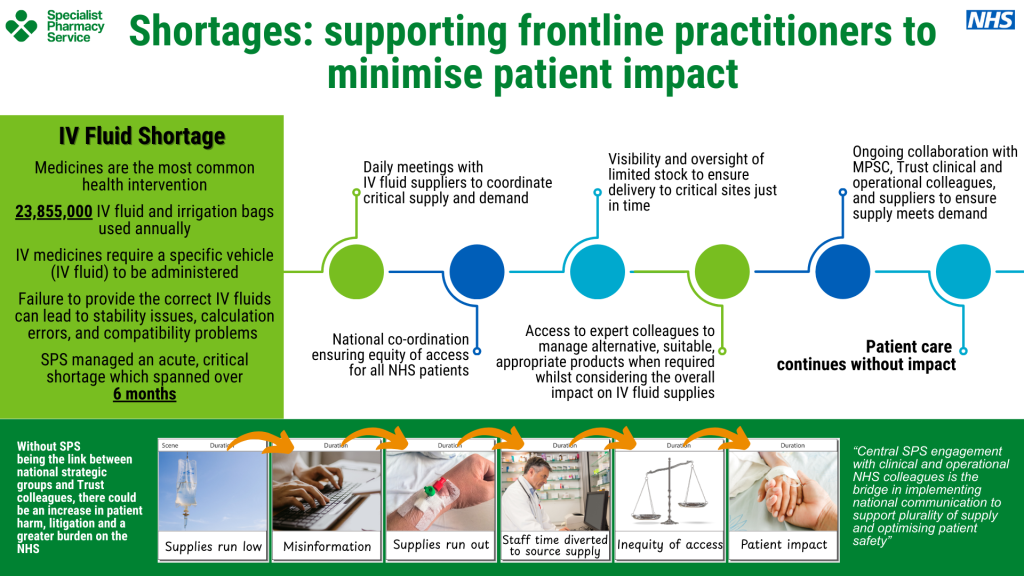
A slide titled “Shortages: supporting frontline practitioners to minimise patient impact” from the NHS Specialist Pharmacy Service (SPS).
On the left, a large green box titled “IV Fluid Shortage” explains:
- Medicines are the most common health intervention.
- 23,855,000 IV fluid and irrigation bags are used annually.
- IV medicines require specific fluids for administration.
- Incorrect IV fluids can cause stability issues, calculation errors, and compatibility problems.
- SPS managed an acute, critical shortage that lasted over 6 months.
Across the middle of the slide is a horizontal pathway with circular icons, describing coordinated actions:
- Daily meetings with IV fluid suppliers to coordinate supply and demand.
- National coordination ensuring equal access to IV fluids for all NHS patients.
- Access to expert colleagues to suggest alternative, suitable products when needed.
- Visibility and oversight of stock to ensure delivery to critical sites just in time.
- Ongoing collaboration with national operational teams and suppliers to ensure supply meets demand.
A label at the end of the pathway reads: “Patient care continues without impact.”
At the bottom is a row of icons showing risks without SPS involvement:
- Supplies running low
- Misinformation
- Supplies running out
- Staff time diverted to sourcing supply
- Inequity of access
- Patient impact
Each icon corresponds to a small illustrative photograph or graphic.
In the bottom right corner is a testimonial inside a green speech bubble stating:
“Central SPS engagement with clinical and operational teams allowed a single point of national oversight. Consistent communication to regional pharmacy supported safety and optimising patient safety.”
NHS and SPS logos appear at the top.
Image 4: Biosimilars
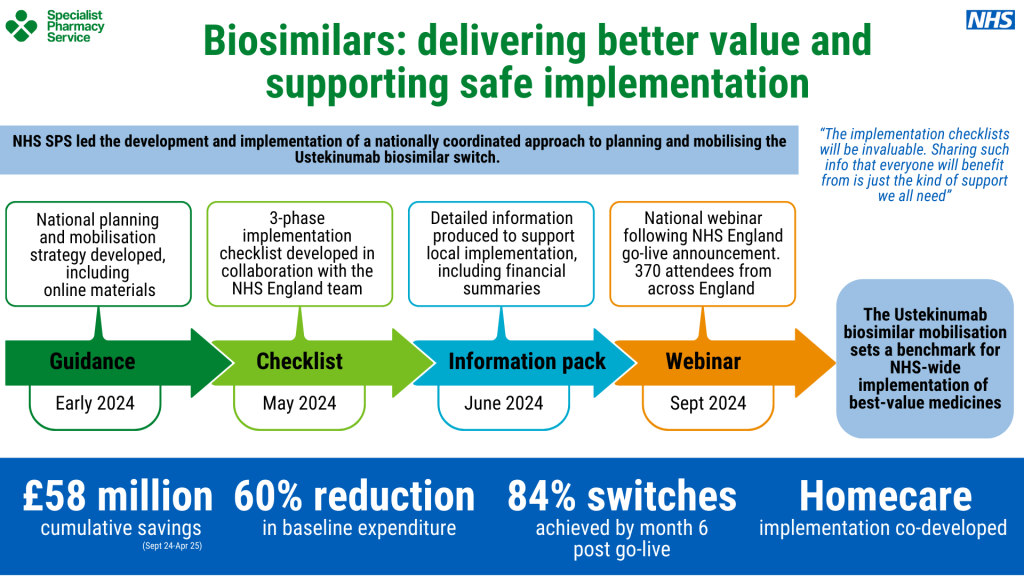
A slide titled “Biosimilars: delivering better value and supporting safe implementation” from the NHS Specialist Pharmacy Service (SPS).
A subtitle states that NHS SPS led a nationally coordinated approach to planning and mobilising the ustekinumab biosimilar switch.
Across the top, four text boxes describe key activities:
- National planning and mobilisation strategy developed with online materials.
- Three phase implementation checklist co developed with the NHS England team.
- Detailed information pack produced to support local implementation, including financial summaries.
- National webinar delivered after the NHS England go live announcement, with 370 attendees from across England.
Below these, a horizontal sequence of labelled arrows shows the timeline:
- Guidance – Early 2024
- Checklist – May 2024
- Information pack – June 2024
- Webinar – September 2024
To the right, a blue quote box reads: “The implementation checklists will be invaluable. Sharing such info that everyone will benefit from is just the kind of support we all need.”
Next to it is a light blue box stating: “The Ustekinumab biosimilar mobilisation sets a benchmark for NHS wide implementation of best value medicines.”
At the bottom, five outcome metrics are shown in bold text:
- £58 million cumulative savings (Sept 2024–Apr 2025)
- 60% reduction in baseline expenditure
- 84% switches achieved by month 6 post go live
- Homecare implementation co-developed
NHS and SPS logos appear at the top.
Image 5: Horizon scanning
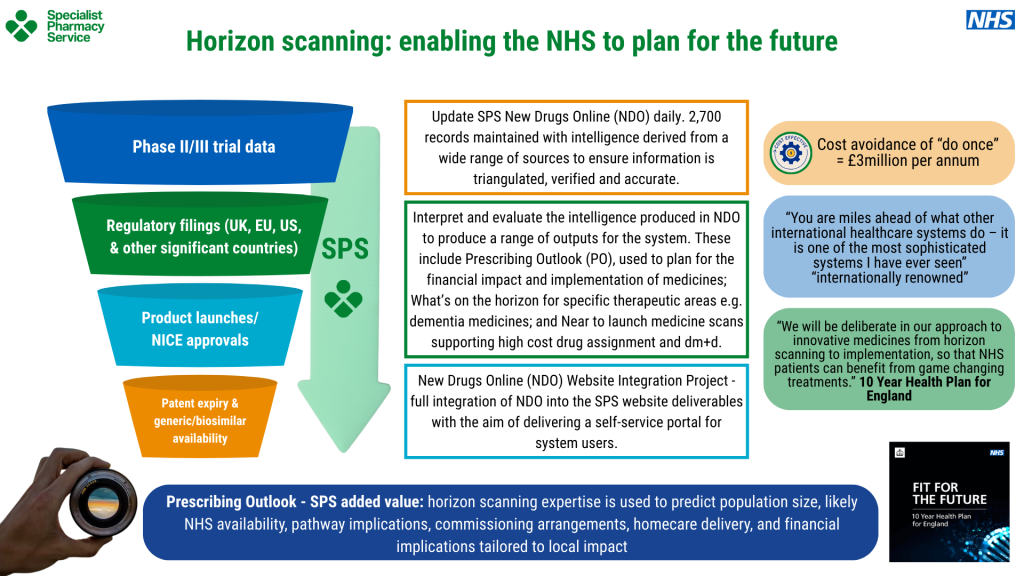
A slide titled “Horizon scanning: enabling the NHS to plan for the future” from the NHS Specialist Pharmacy Service (SPS).
On the left, a funnel graphic shows four inputs feeding into SPS horizon scanning work:
- Phase II/III trial data (dark blue section)
- Regulatory filings from the UK, EU, US and other countries (green section)
- Product launches and NICE approvals (teal section)
- Patent expiry and generic or biosimilar availability (orange section)
In the centre, the SPS logo is displayed. Three text boxes describe key activities:
- New Drugs Online (NDO) updates: around 2,700 records maintained with intelligence drawn from multiple sources to ensure information is triangulated, verified and accurate.
- Interpret and evaluate intelligence to produce a range of outputs: information supports Prescribing Outlook and financial and population impact planning. Includes horizon scans for therapeutic areas such as dementia medicines and high cost drug forecasting.
- NDO Website Integration Project: integrating NDO into the SPS website to create a self service portal for users.
On the right, three rectangular elements highlight benefits and testimonials:
- A yellow circle stating Cost avoidance of “do once” = £3 million per annum.
- A blue speech bubble with a testimonial: “You are miles ahead of what other international healthcare systems do – it is one of the most sophisticated systems I have ever seen.”
- A green speech bubble referencing the 10 Year Health Plan for England, emphasising deliberate approaches to planning innovative medicines to support future treatments.
At the bottom, a banner titled Prescribing Outlook – SPS added value explains that horizon scanning expertise is used to predict population size, medicine availability, pathway implications, commissioning needs, homecare delivery, and financial implications tailored to local impact. A small image of the NHS “Fit for the Future” 10-year health plan for England appears on the right.
NHS and SPS logos appear at the top.
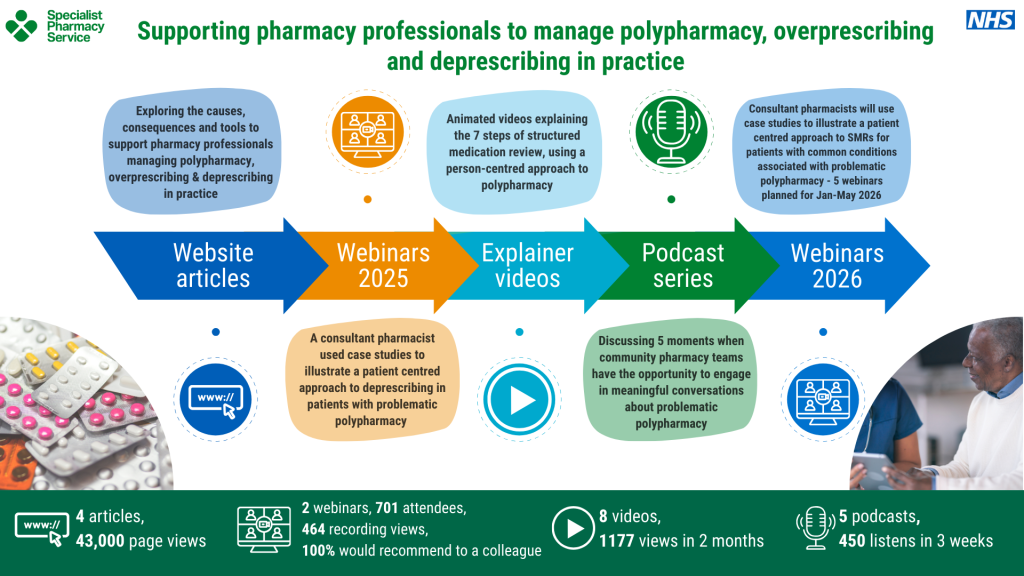
Image 6: Supporting pharmacy professionals to manage polypharmacy, overprescribing and deprescribing in practice
A slide titled “Supporting pharmacy professionals to manage polypharmacy, overprescribing and deprescribing in practice” from the NHS Specialist Pharmacy Service (SPS).
Across the top, three boxes describe key learning content:
- A grey box explains exploration of causes, consequences, and tools to support pharmacy professionals in polypharmacy, overprescribing, and deprescribing.
- An orange box describes animated videos explaining the seven steps of structured medication review using a person centred approach to polypharmacy.
- A green box states that consultant pharmacists will use case studies to illustrate a patient centred approach to structured medication reviews for people with common conditions associated with problematic polypharmacy; webinars planned from January to May 2026.
Below this is a horizontal arrow timeline with coloured segments labelled:
- Website articles
- Webinars 2025
- Explainer videos
- Podcast series
- Webinars 2026
Beneath this, two boxes contain further descriptions:
- A pale orange box states that a consultant pharmacist used case studies to illustrate deprescribing in patients with problematic polypharmacy.
- A green box summarises a podcast discussion about five moments when community pharmacy teams can have meaningful conversations about problematic polypharmacy.
At the bottom of the slide, a results bar showcases engagement numbers:
- 4 articles with 43,000 page views
- 2 webinars, 701 attendees, 464 recording views, and 100% would recommend to a colleague
- 8 videos with 1,177 views in 2 months
- 5 podcasts with 450 listens in 3 weeks
On the left, there is an image of various medicines in blister packs. On the right, there is a healthcare interaction taking place inside a clinical room.
NHS and SPS logos appear at the top.
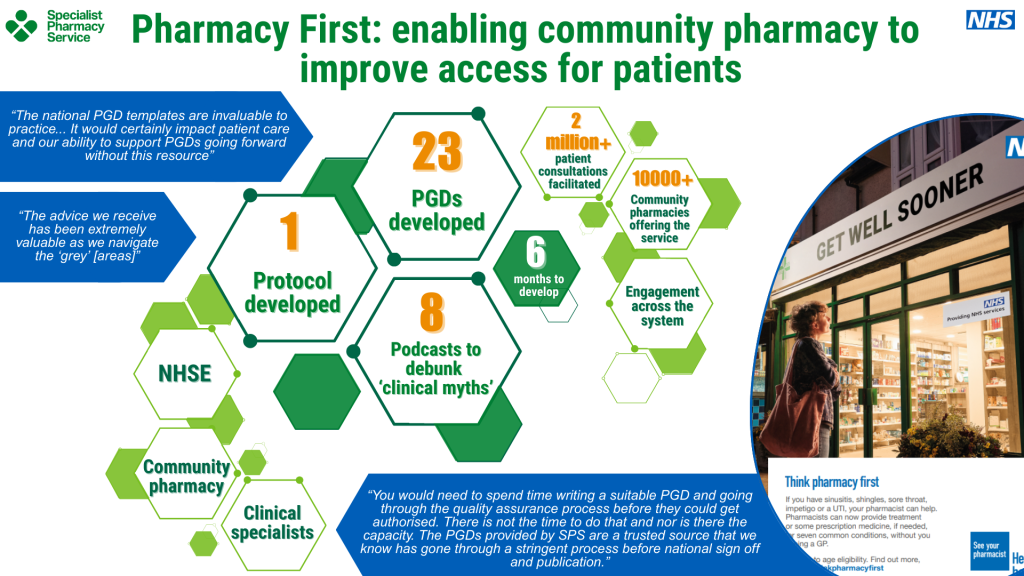
Image 7: Pharmacy First
A slide titled “Pharmacy First: enabling community pharmacy to improve access for patients” from the NHS Specialist Pharmacy Service (SPS).
On the left, two blue quote boxes contain feedback.
The first says: “The national PGD templates are invaluable to practice… It would certainly impact patient care and our ability to support PGDs going forward without this resource.”
The second says: “The advice we receive has been extremely valuable as we navigate the grey [areas].”
In the centre is a large hexagon based infographic showing key achievements:
- 23 PGDs developed (in a large central orange hexagon).
- 1 protocol developed (yellow hexagon).
- 6 months to develop (green hexagon).
- 8 podcasts to debunk ‘clinical myths’ (orange hexagon).
- Additional surrounding green hexagons labelled:
- NHSE
- Community pharmacy
- Clinical specialists
To the right of the central diagram:
- A yellow hexagon states “2 million+ patient consultations facilitated.”
- A green hexagon states “10,000+ community pharmacies offering the service.”
- A yellow hexagon states “Engagement across the system.”
On the far right, an image shows a pharmacy storefront with a sign reading “GET WELL SOONER.” A display board inside the store reads “Think pharmacy first.”
At the bottom, a blue text box contains a long testimonial explaining that SPS PGDs save time, ensure robust governance, and are a trusted source.
NHS and SPS logos appear at the top.
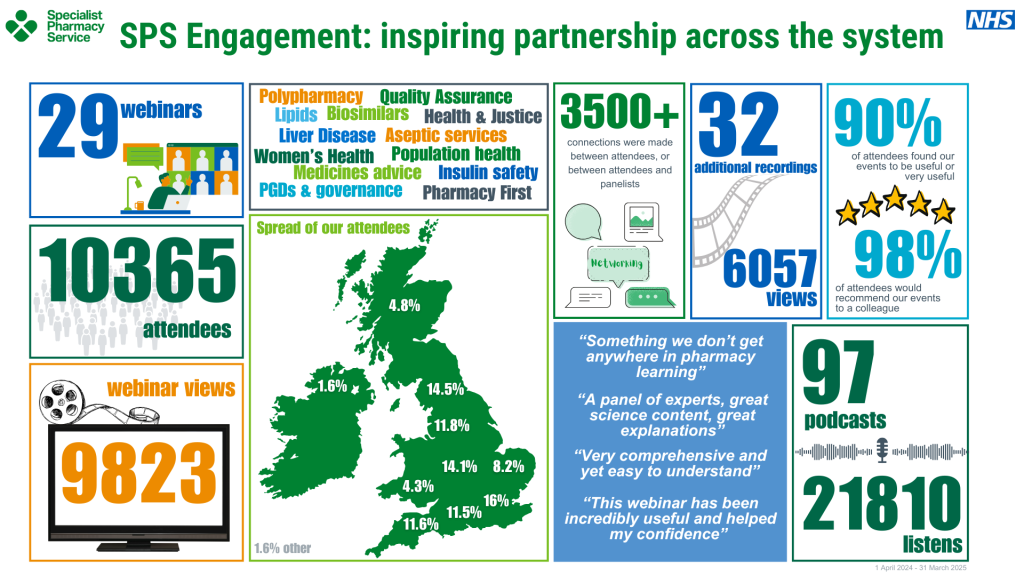
Image 8: SPS Engagement
A slide titled “SPS Engagement: inspiring partnership across the system” from the NHS Specialist Pharmacy Service (SPS).
The slide presents multiple engagement statistics in separate boxes:
- A blue box shows “29 webinars” with an illustration of people attending an online session.
- A large green box displays “10,365 attendees” in bold text.
- Below that, a light blue box shows “9,823 webinar views” with an icon of a computer monitor.
In the centre, a green map of the United Kingdom shows the spread of attendees with labelled percentage figures for each region. Examples include: 1.6% for Northern Ireland, 4.8% for Scotland, 14.5% for the North West, 11.8% for Yorkshire and Humber, 14.1% for the East of England, 16% for the South East, 15.1% for London, and other regional percentages. A note indicates 1.8% “other.”
Above the map, a text cloud lists webinar topic areas, including polypharmacy, quality assurance, health and justice, lipids, biosimilars, liver disease, aseptic services, women’s health, population health, insulin safety, medicines advice, pharmacy first, and PGDs and governance.
Another green box shows “3500+ connections made”, accompanied by an illustration of networking and collaboration.
A dark blue box displays “32 additional recordings” and “6057 views.”
A large blue box states: “90% of attendees found our events to be useful or very useful” with a five star illustration. Beneath that, “98% would recommend our events to a colleague.”
Three testimonial quotes appear in a light blue box:
- “Something we don’t get anywhere in pharmacy learning.”
- “A panel of experts, great science content, great explanations.”
- “Very comprehensive and yet so easy to understand.”
- “This webinar has been incredibly useful and helped my confidence.”
On the far right, a green box shows “97 podcasts” and “21,810 listens” with an illustration of headphones.
At the bottom, a date note states: “1 April 2024 to 31 March 2025.”
NHS and SPS logos appear at the top.
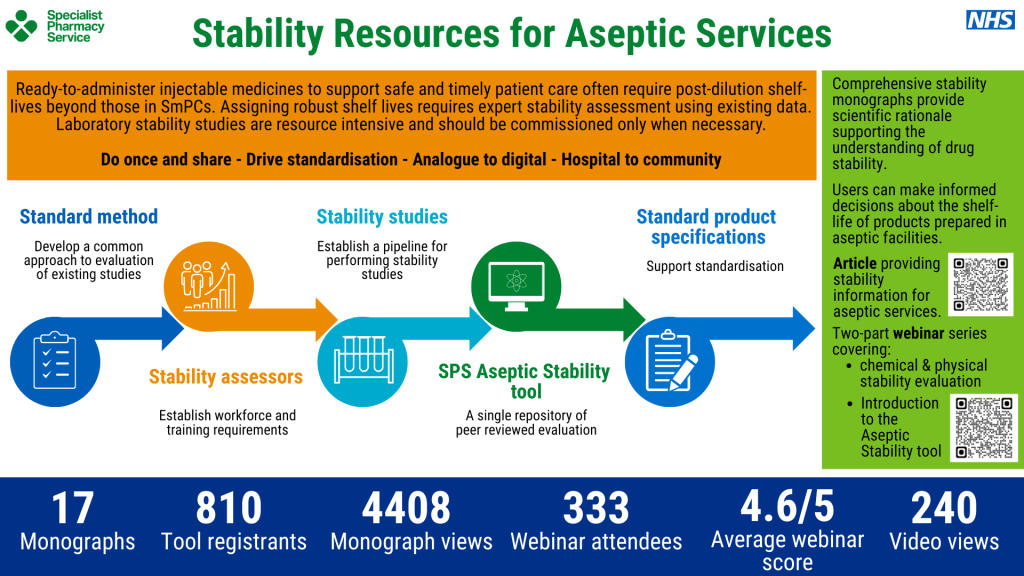
Image 9: Stability Resources for Aseptic Services
A slide titled “Stability Resources for Aseptic Services” from the NHS Specialist Pharmacy Service (SPS). The slide describes resources supporting stability assessment of injectable medicines.
A large orange box explains that ready to administer injectable medicines often need stability assessments beyond those in SmPCs and expert review and standardised methods help avoid unnecessary studies. A highlighted line reads: “Do once and share – Drive standardisation – Analogue to digital – Hospital to community.”
Below this, a horizontal process diagram shows four stages:
- Standard method – icon of a checklist; text: “Develop a common approach to evaluation of existing studies.”
- Stability assessors – icon of people and a graph; text: “Establish workforce and training requirements.”
- Stability studies – icon of test tubes in a rack; text: “Establish a pipeline for performing stability studies.”
- SPS Aseptic Stability Tool – icon of a computer screen; text: “A single repository of peer reviewed evaluation.”
- Standard product specifications – icon of a checklist; text: “Support standardisation.”
On the right side, a green box states comprehensive stability monographs provide scientific rationale supporting the understanding of drug stability enabling users to make informed decisions about the shelf-life of products prepared in aseptic facilities. It highlights an article providing stability information for aseptic services and a two part webinar series: chemical and physical stability evaluation, and an introduction to the Aseptic Stability Tool.
At the bottom, performance metrics are displayed:
- 17 monographs
- 810 tool registrants
- 4408 monograph views
- 333 webinar attendees
- 4.6/5 average webinar score
- 240 video views
NHS and SPS logos appear at the top.
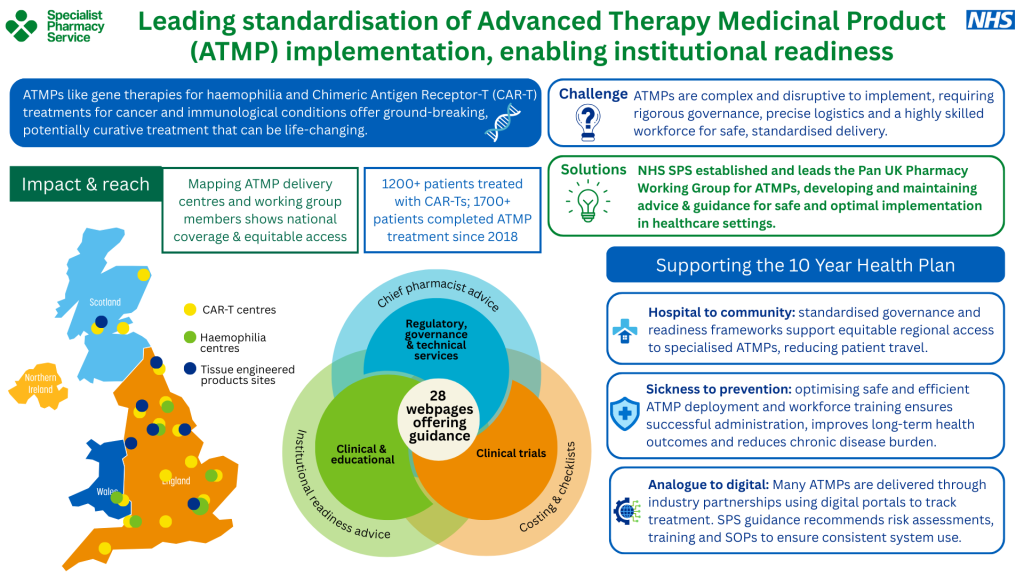
Image 10: Leading standardisation of Advanced Therapy Medicinal Product (ATMP) implementation, enabling institutional readiness
A slide titled “Leading standardisation of Advanced Therapy Medicinal Product (ATMP) implementation, enabling institutional readiness” from the NHS Specialist Pharmacy Service (SPS).
A blue text box explains ATMPs, including gene therapies for haemophilia and Chimeric Antigen Receptor T (CAR T) therapies offer potentially curative treatment that can be life changing.
A blue box labelled Challenge states that ATMPs are complex, disruptive to implement, and require rigorous governance, precise logistics, and a highly skilled workforce.
A green box labelled Solutions states that NHS SPS and the Pan UK Pharmacy Working Group for ATMPs develop and maintain advice and guidance for safe, standardised implementation.
On the left, a section titled Impact & reach contains several components:
- A map of the United Kingdom showing coverage of CAR T centres, haemophilia centres, and tissue engineered product sites.
- A text box describing mapping of ATMP delivery sites and working group membership shows national coverage and equitable access.
- Another box stating 1200+ patients treated with CAR Ts and 1700+ patients completed ATMP treatment since 2018.
Below this is a circular Venn style diagram with overlapping coloured segments labelled:
- Regulatory, governance and technical services
- Clinical and educational
- Clinical trials
- Costing and contracts
At the centre, a text label reads 28 webpages offering guidance, with a surrounding label that reads Institutional readiness advice.
On the right side, a large blue section is titled Supporting the 10 Year Health Plan, with three text boxes beneath:
- Hospital to community: standardised governance ensures equitable regional access to specialised ATMPs and reduces patient travel.
- Sickness to prevention: safe deployment of ATMP services improves long term health outcomes and reduces chronic disease burden.
- Analogue to digital: many ATMPs use digital tools to track treatment; SPS guidance supports consistent system use, training, and risk mitigation.
NHS and SPS logos appear at the top.